TRENDS
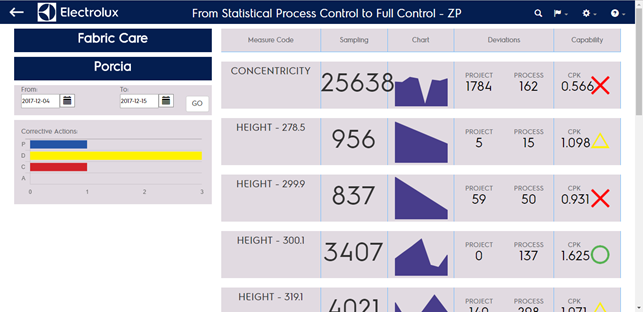
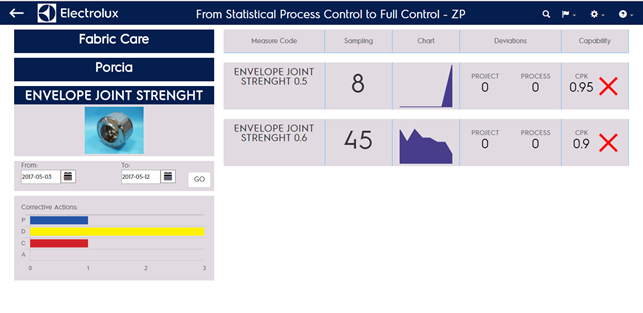
The TRENDS page shows the list of the measures currently mapped for the selected parameter in the selected period (last 30 days as default).
In this page you will see on the left top-down:
- Product Line
- Factory
- Parameter
- Paramater picture
- Selected period
- Corrective actions
In the right side of the page there is the list of the measures mapped for that parameter. You can see left-right:
- Measure name
- Number of samples existing in the selected period
- Area chart reporting the samples collection flow in the selected period
- Number of total deviations compared to project specifications
- Number of total deviations compared to process specifications
- Total Cpk for the measure in the selected period
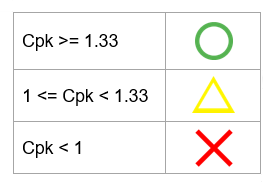
- Icon representing the Cpk as follows
Clicking on the measure name you can get to the Capability Full Page of the selection
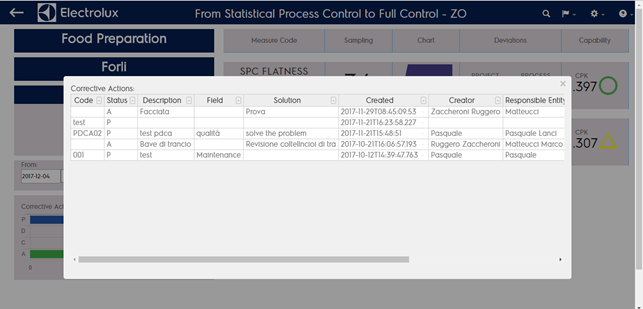
By clicking on the corrective actions graph you can show the list of corrective actions reported in the orizontal bar chart.
In case you’ve reached this page bypassing the cataegory selection (clicking on “all” in the parameter column in the home page) you wan’t see any catagory mentioned in teh left column and you will see all the measures collected in the selected period enev if not mapped in any category