CAPABILITY FULL PAGE
The Capability Full Page structure is made of:
- Filtering header
- Details column
- SPC body
FILTERING HEADER
In the inquiring setting area you can find all the dimensions that have impact on the spc body:
- MEASURE CODES: all the measure available in the cataegory selected
- PARTS: all the parts code involved in the analysis
- SUBDIVISIONS: all the subdivisions where ther measurements have been made
- CONTROL SHEETS: procedures/version claimed by measures made
- DATE FROM: initial date/time of the period
- DATE TO: finale date/time of the period
- GROUP NUMBER: number of samples contained in a group (default depends on the plant configuration -> measure settings)
- SHORT/LONG TERM ANALYSIS: selector of sigma estimator calculation (default depends on the measure settings)
You can change measures and dimensions easily using the combo box in the header, to apply che changes just click on “filter” button. Using the “go to factory” button you can reach the local installation (if existing). You can hide the header using the arrow on the right bottom of the header. The EXPORT BUTTON downloads the values currently shown in the page in a excel sheet.
DETAILS COLUMN
In the details column you can find:
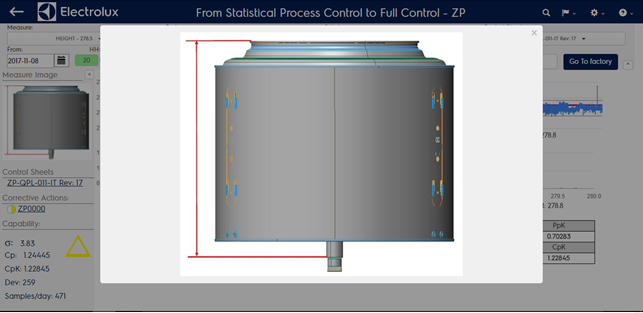
- PICTURE: describes visually the measure selected (mapped in plant configuration -> measure settings). You can enlarge the picture by clickin on it.
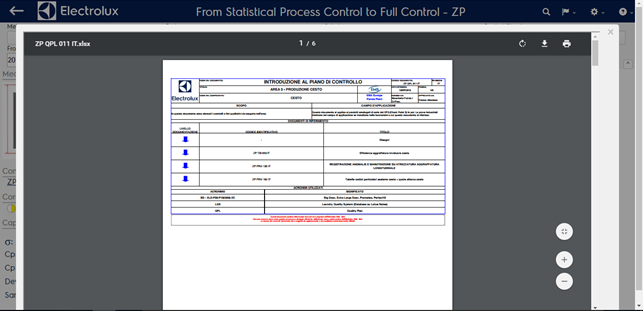
- CONTROL SHEETS: each procedure code and version included in analysis (clickin on the procedure name you can show the pdf of the procedure (mapped in plant configuration measure settings)
- CORRECTIVE ACTIONS: every corrective action created in the period selected and linked somehow to CSUS/ANOMALY/MEASURE/SURVEY included in the analysis
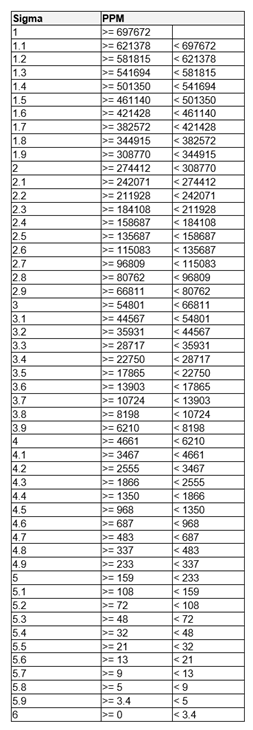
- TOTAL CAPABILITIES EVALUATION: process sigma level, Cp, Cpk, qualititative estimation of Cpk, total process deviations and average sample per day in the period). The sigma value of process is related to defects per milion opportunities (PPM actual) as follows:
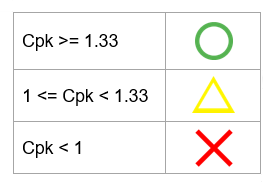
The qualitative estimation of Cpk is calculated as follows
You can hide the left column using the arrow on the right top of the column, near the measure image. Clicking on the control sheet listed in the left column you will show the pdf of the procedure selected:
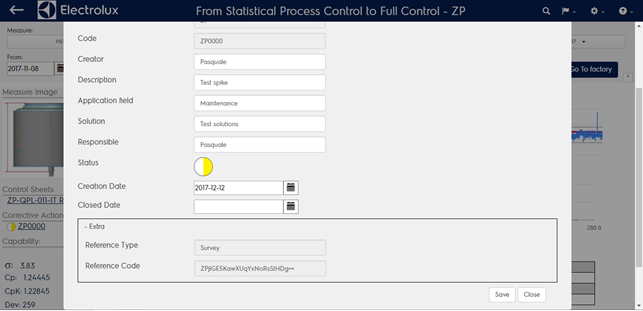
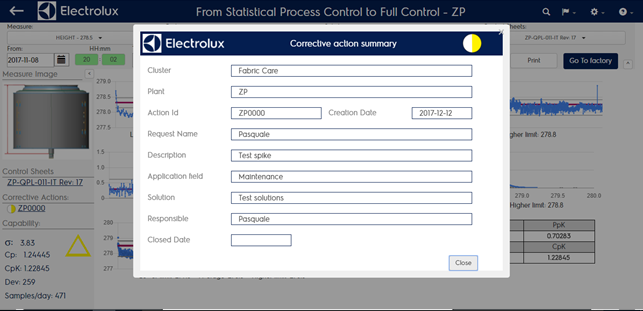
Clicking on a corrective action listed you will show a popup form with the details of the selected corrective action (not editable)
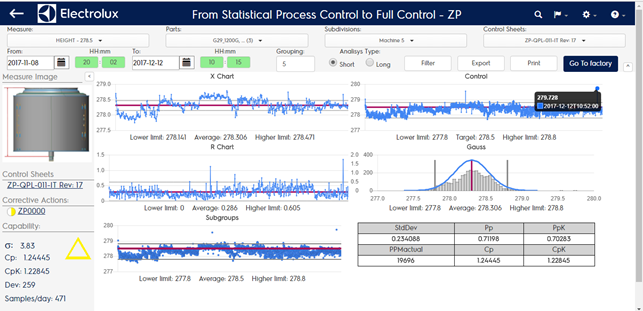
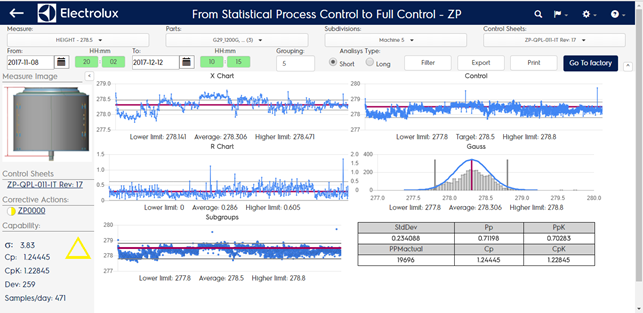
SPC BODY
In the SPC body you can find:
- X CHART
- R CHART
- GROUP CHART
- CONTROL CHART
- GAUSS CHART
- CAPABILITIES TABLE: Standard deviation, Pp, Ppk, PPmActual, Cp, Cpk
By clicking on the single value in the control chart is possible to add and show a corrective action that is directly linked to that sample (editable).