PARAMETER HOME PAGE
To use the system by category you have to connect to the home page by selecting the url: http://79.137.83.120.
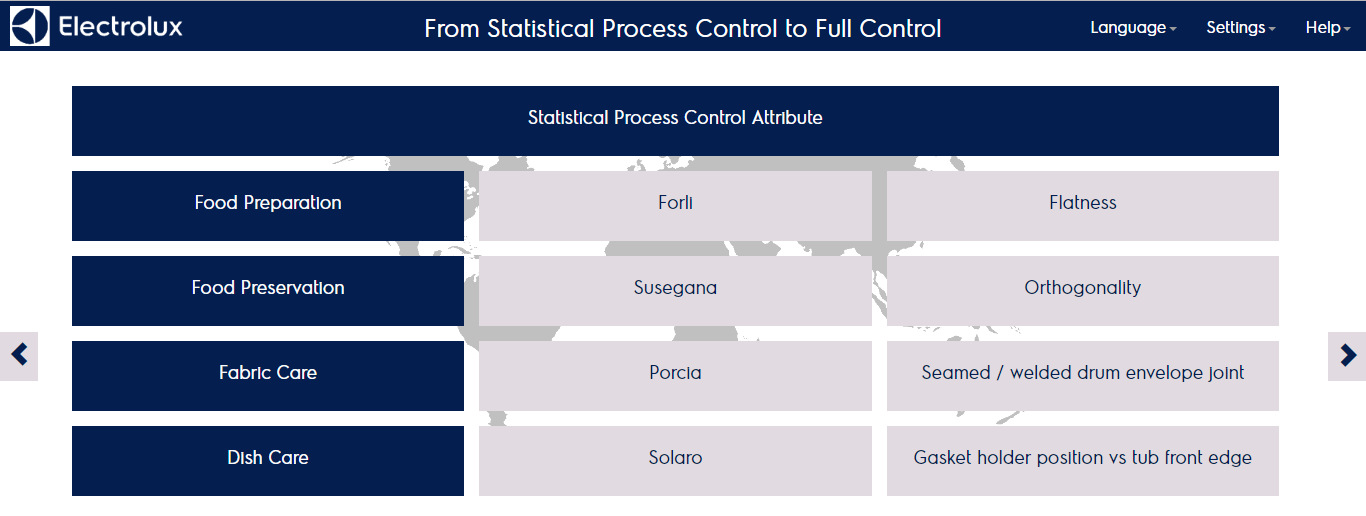
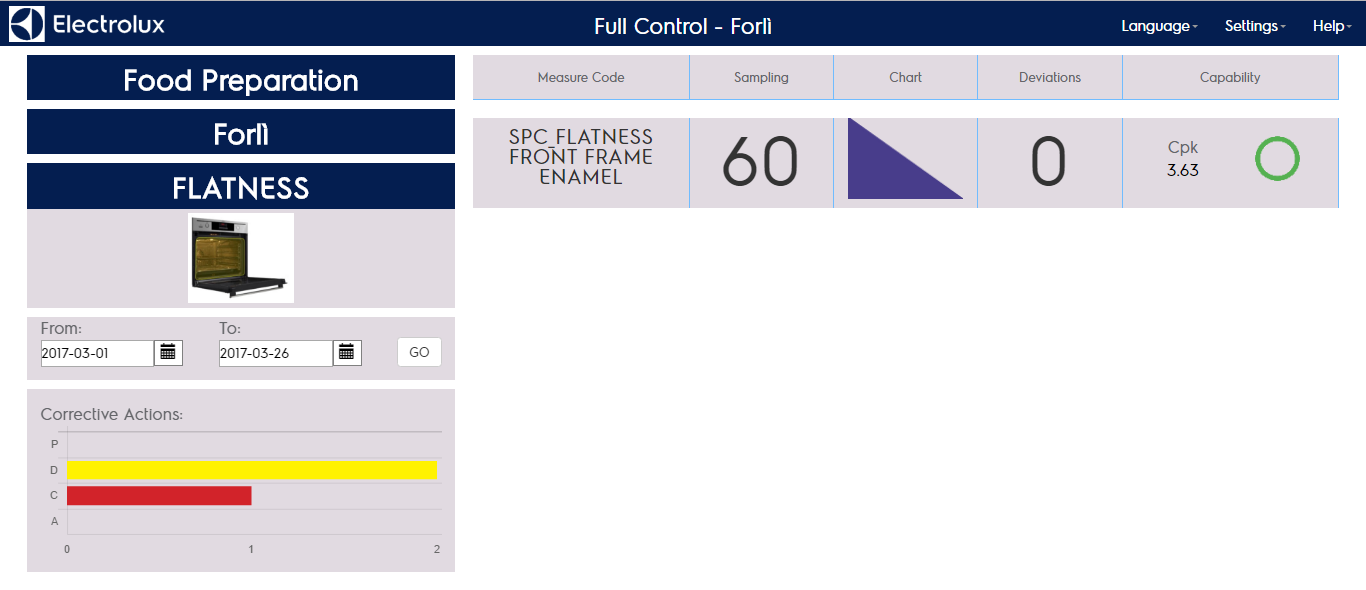
The home page reports the product lines on the left column, the factories and the category defined. Each category is clickable and leads to the main category home page:
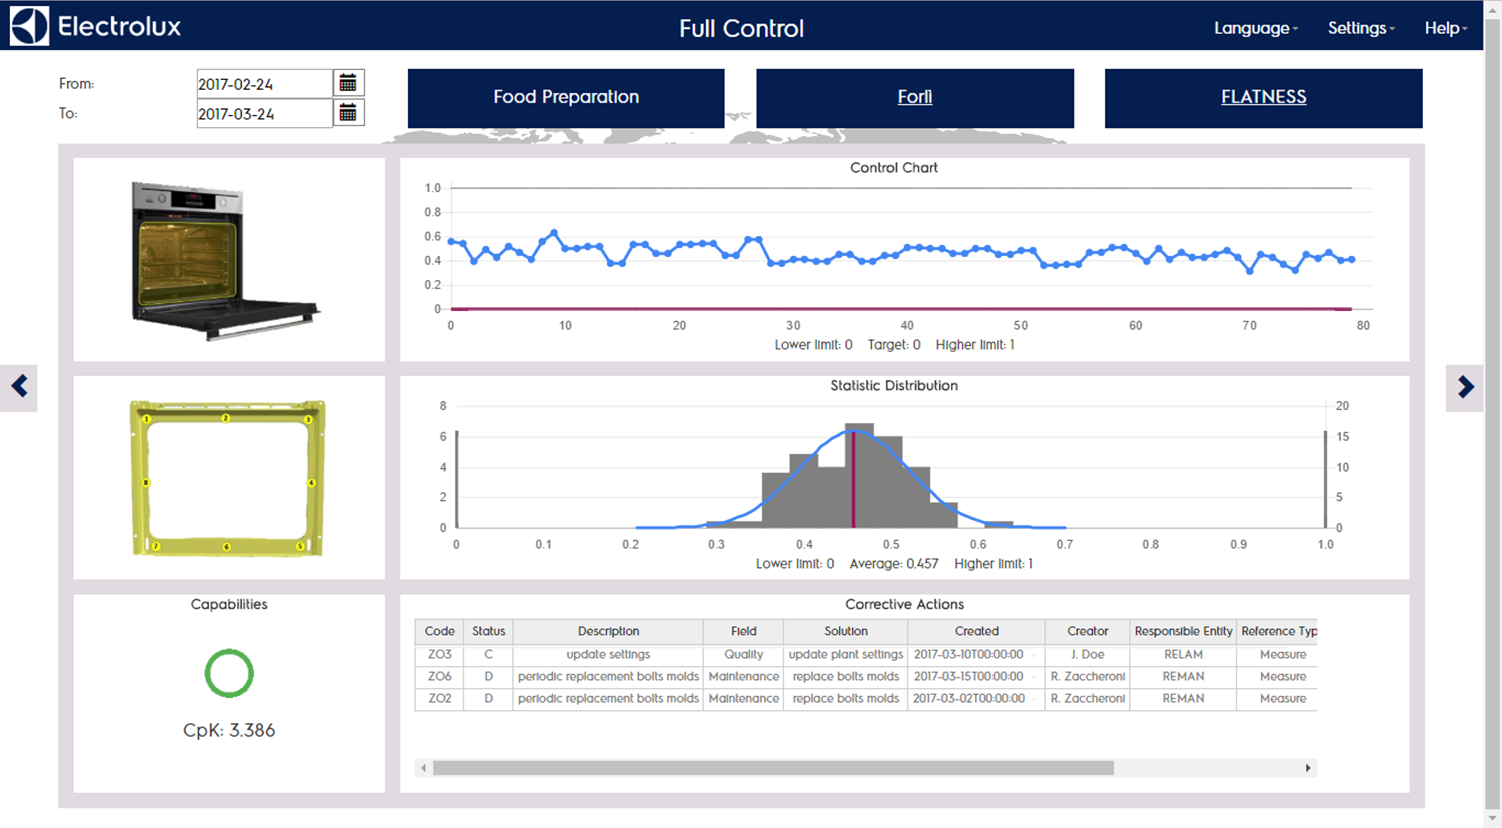
This page is about the default measure setted for the category selected, there you can find:
- Date picker top left to select the enquiry period
- Product line, Factory and Category currently selected
- Category picture
- Measure picture
- Control chart of the measure in the period
- Gauss chart of the measure in the period
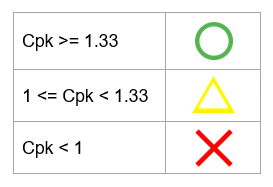
- Capability (Cpk) of the period and qualitative estimation of it according to the mapping:
- Corrective actions connected to the measure and created in the period
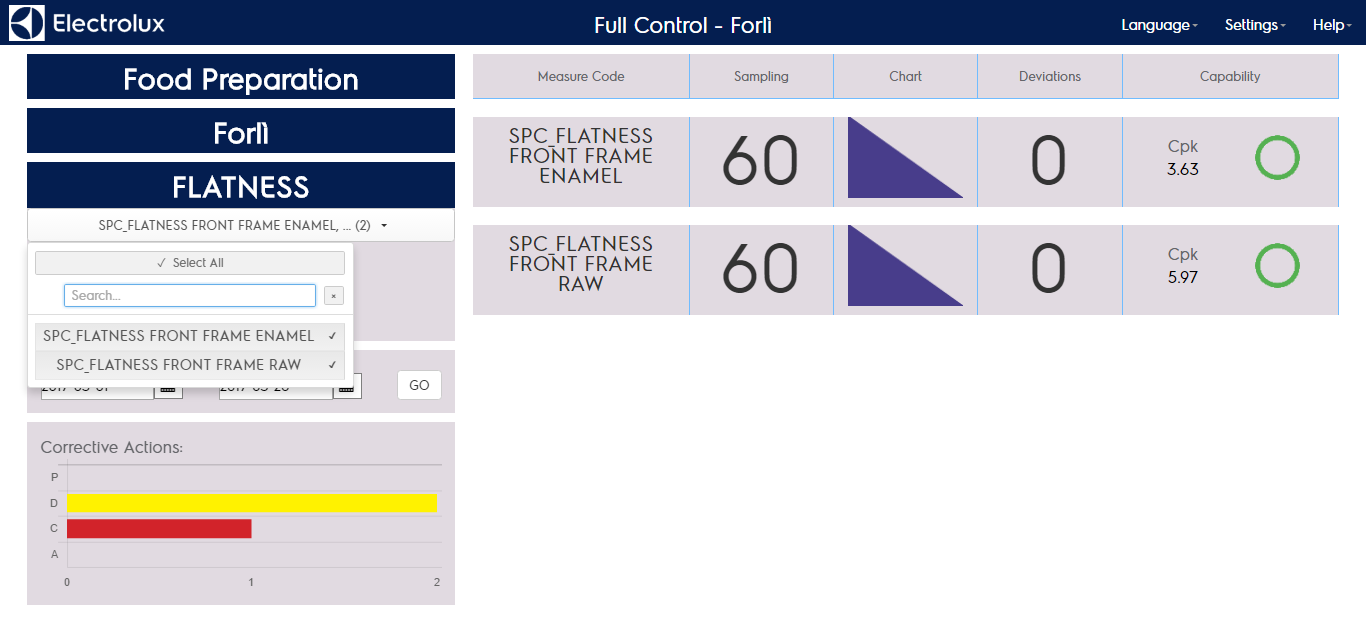
Clicking on the category name (top right) you can have access to page where are shown the total number of samples collected in periods for that category:
- Current week
- Current month
- Previous month
- Previous quarter
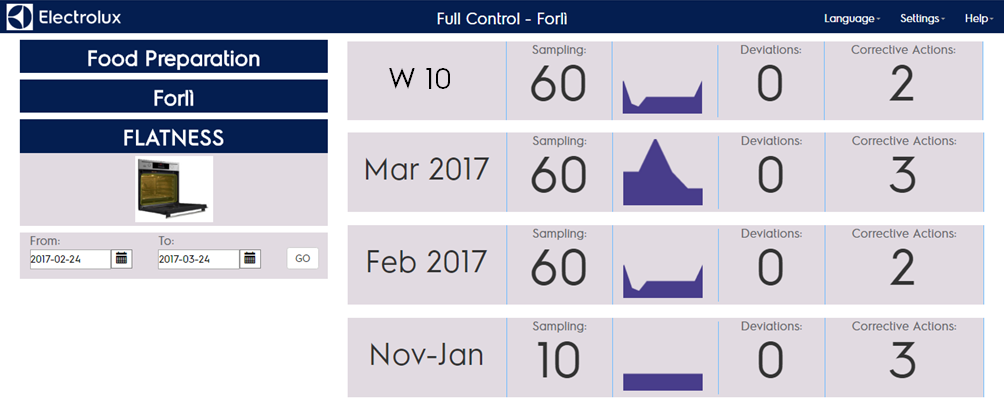
For each period are reported:
- Total samples collected
- Sampling collection distribution in the period
- Totale numbers of deviations (values not compliant with project specifications) in the period
- Totale numbers of corrective actions in the period
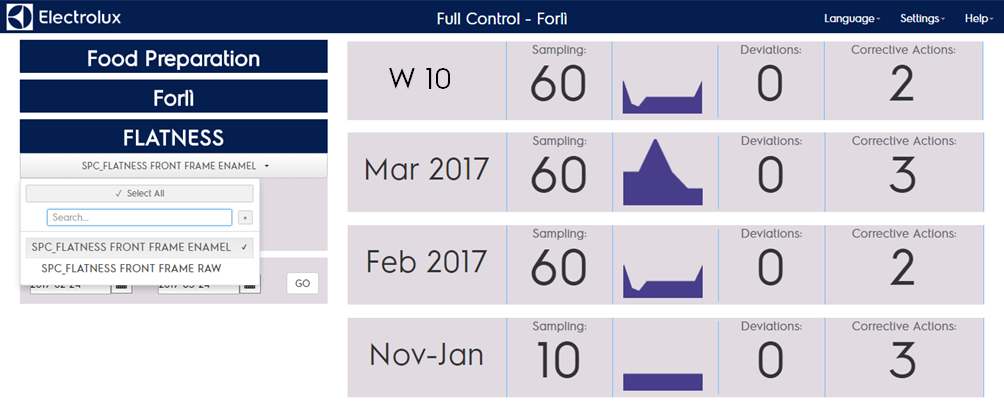
The page loads values coming from the default measure of the category, to change that selection you can click on the category name and add/remove selections. Once the selection is changed the numbers on the page will change according to the new selection:
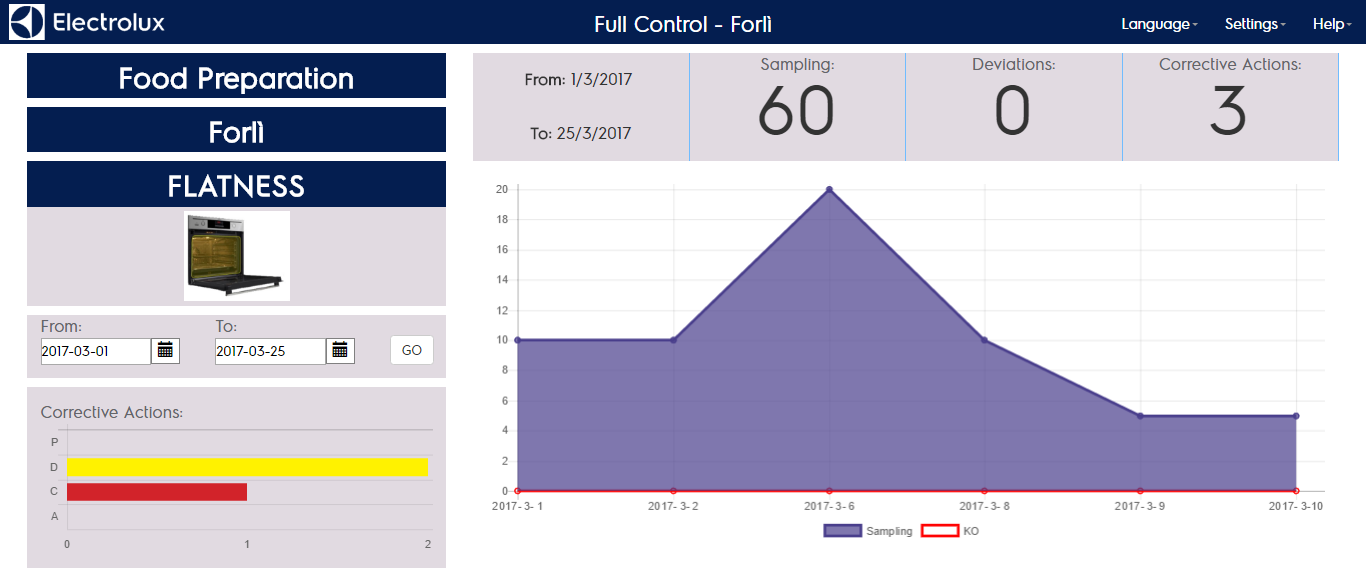
This page can be filtered by date using the date picker on the left or selecting one of the boxes. The data selection leads to the next page where the single period is added with more in details:
- Corrective actions chart grouped by status (P,D,C,A)
- Chart of sampling and deviation trend
The page loads values coming from the default measure of the category, to change that selection you can click on the category name and add/remove selections. Once the selection is changed the numbers on the page will change according to the new selection:
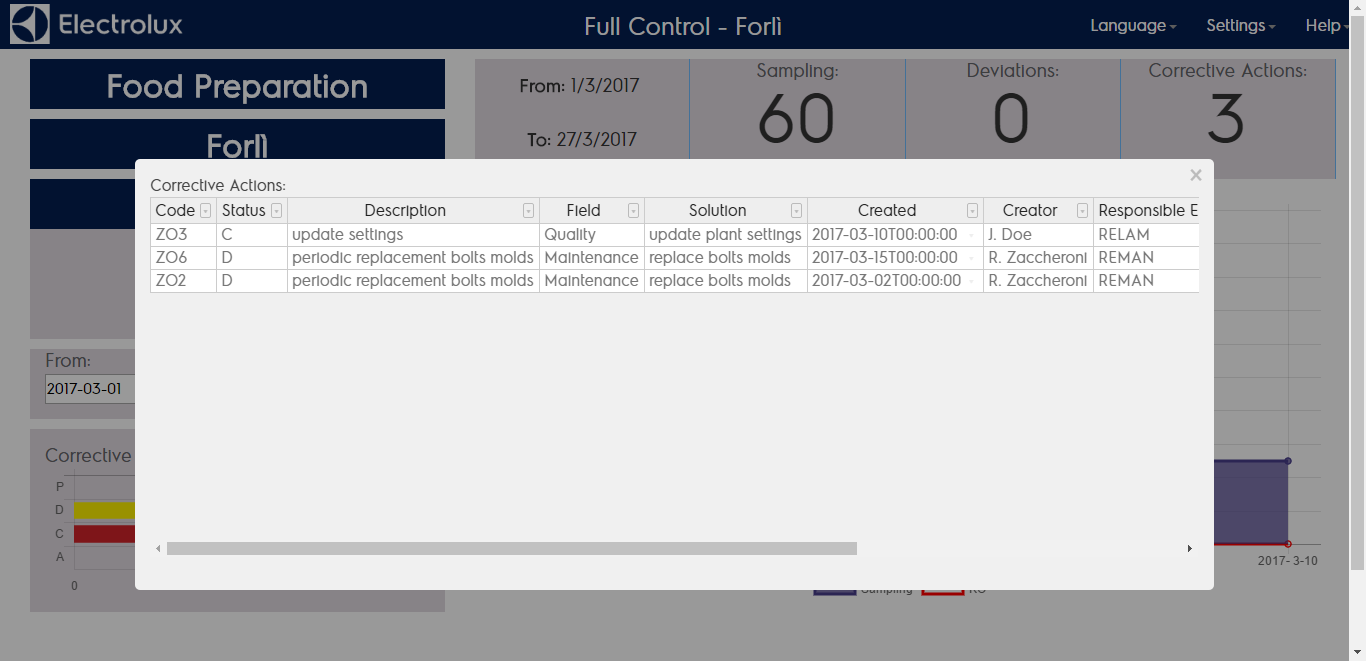
By clicking on the corrective actions graph you can show the list of corrective actions reported in the orizontal bar chart.
Clicking on the grey box on top right you can get to the list of measures currently included in the category. The initial measure shown is the one setted as default in the category configuration.
To change that selection you can click on the category name and add/remove selections. Once the selection is changed the numbers on the page will change according to the new selection. Finally clicking on the measure name you can get to the measure capabilities page.