
TRENDS
The TRENDS page shows the list of the measures currently mapped for the selected parameter in the selected period (below the factory name on the left column). The default period is the last 30 days.
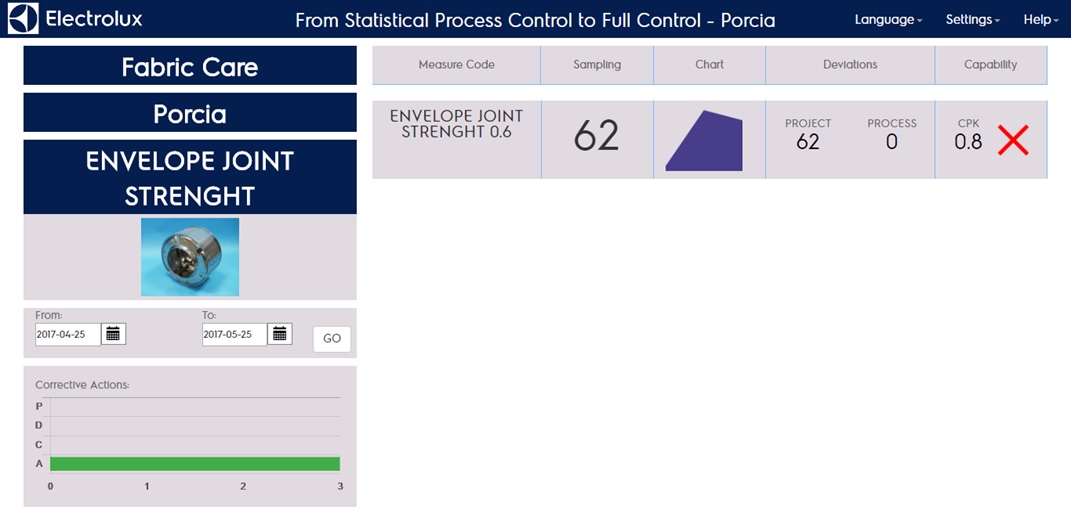
In this page you will see on the left top-down:
- Product Line
- Factory
- Parameter
- Paramater picture
- Selected period
- Corrective actions
In the right side of the page there is the list of the measures mapped for that parameter. You can see left-right:
- Measure name
- Number of samples existing in the selected period
- Area chart reporting the samples collectionflow in the selected period
- Number of total deviations compared to project specifications
- Number of total deviations compared to process limits
- Total Cpk for the measure in the selected period
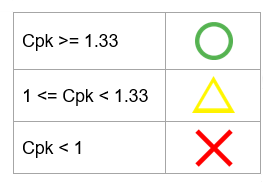
- Icon representing the Cpk as follows
Clicking on the measure name you can get to the Capability Full Page