GROUPING = 1
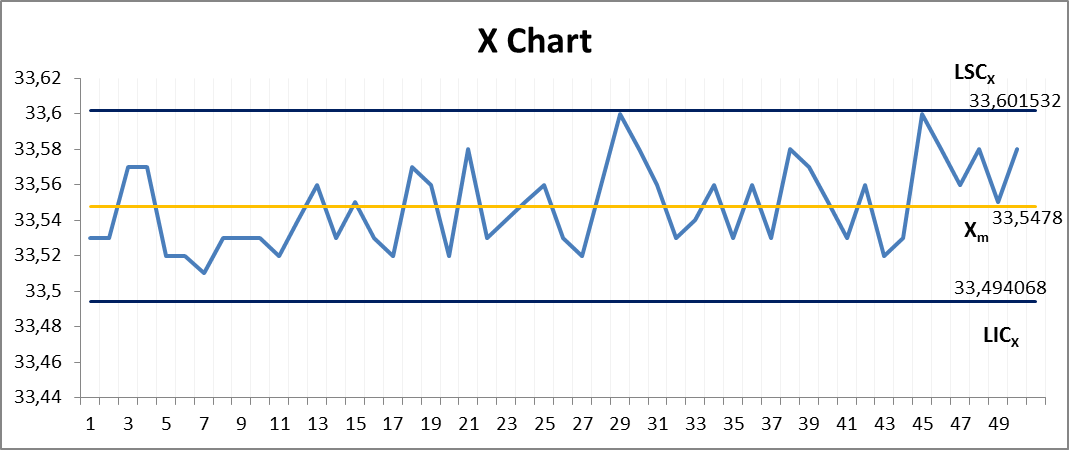
LSCX = UCLX = upper control limit for X Chart = Xm + A2 * R
LICX = LCLX = lower control limit for X Chart = Xm - A2 * R where Xm = X
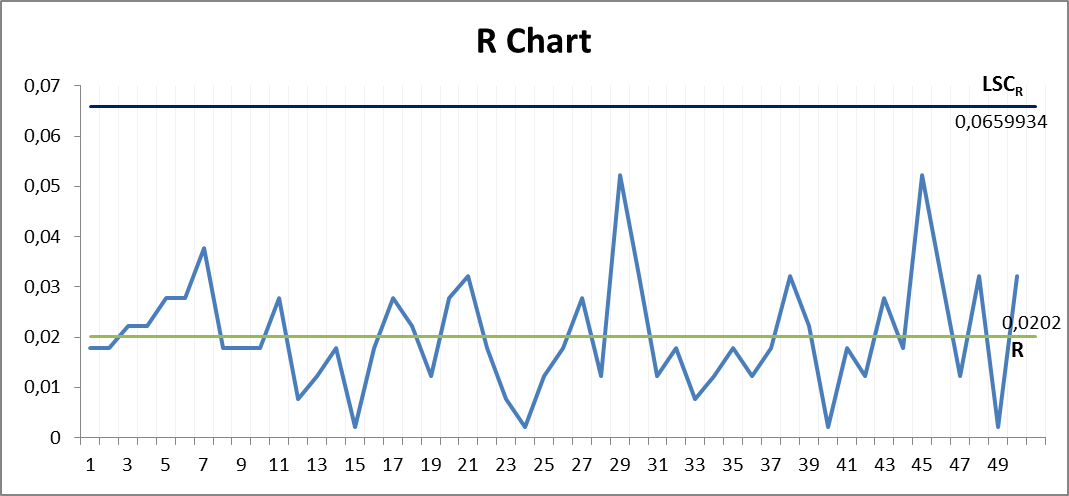
LSCR = upper control limit for R Chart = D4 * R LICR = lower control limit for R Chart = D3 * R
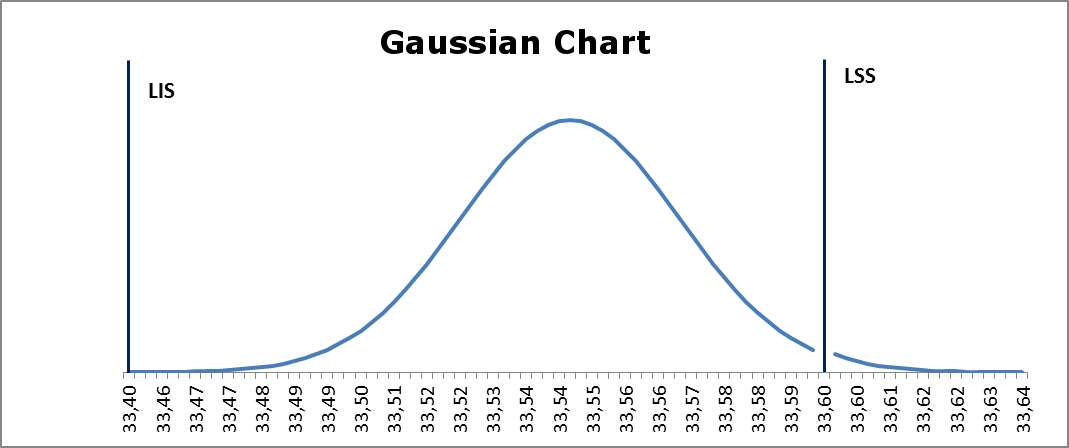
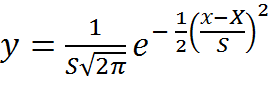
The x and y points of the gaussian chart are calculated as follows:
x = t * S + X
t is a parameter that goes from -4 to +4 step 0,1