GROUPING >= 2
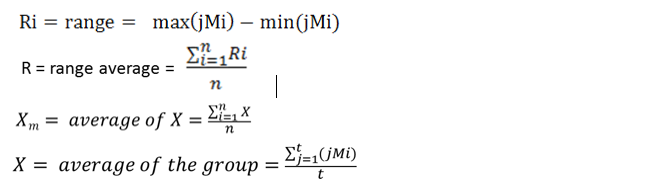
It displays graphicallyIf the valuesgroup includeddimension inis each> subgroup. When1 the groupingreports criteriachange is 1 it overlaps to the control chart.
considering:

It displays graphicallyIf the valuesgroup includeddimension inis each> subgroup. When1 the groupingreports criteriachange is 1 it overlaps to the control chart.
considering: